

Report Prepared by:
Bilge KEYKUBAT
Emran KİŞİ
1. Introduction
When we think of cereal products, wheat, barley, corn, rice, oats, triticale and rye come to mind, all of which hold a very important place in Türkiye’s agricultural sector. These products are significant in terms of the agricultural industry, agricultural trade, as well as nutrition and health. One of the key characteristics of cereals, which are an important source of energy for the human body, is their ability to be stored and preserved for long periods. Thanks to all these characteristics, cereals have maintained their importance from the past to the present and will continue to do so in the future.
As in many parts of the world, carbohydrate-based foods are an indispensable part of meals in Türkiye. Cereals, which are widely consumed and highly appreciated by the population, also have significant production potential in Türkiye due to the country’s favorable climate and soil conditions.
Cereals hold a very important place not only in agricultural production but also in the agriculture and food industries. When industrial activities are taken into consideration, the sector also plays a significant role in terms of employment, value-added products, the economy and environmental safety.
As is well known, wheat is strategically important as a staple food source. It is particularly recognized as the most suitable and affordable cereal for bread production. Wheat is also processed into flour, which has a higher economic value, while its remaining parts can be used as animal feed.
Wheat holds an even more distinctive position within Türkiye’s cereal sector. Wheat is of great importance in meeting the food needs of a large part of the world’s population. It is the raw material of bread, Türkiye’s most fundamental staple food. It is also the raw material used in widely consumed products such as bulgur and semolina. Although bread consumption in Türkiye has been declining year by year, according to various sources, Türkiye still ranks first in Europe in terms of bread consumption.
Globally, there is an ongoing wheat supply and consumption challenge that began particularly with the Covid-19 pandemic, intensified by climate change, continued with the Russia–Ukraine war, expanded further due to tensions between India and China and India’s wheat-related policies, and reached an increasingly difficult level amid subsequent global economic problems. The growing world population also remains an important challenge. During this period, countries have sought to increase production, purchase more products from producer countries, maintain larger stocks and engage in increasingly active wheat trade. As a result, substantial global demand for wheat has emerged, directly affecting both wheat prices and production.
2. Wheat
2.1. World Wheat Production
When global wheat cultivation areas are examined, the top five countries/regions are India, Russia, China, the EU and the USA. Cultivation areas, climatic events occurring during the year and differences in production yields can affect countries’ rankings in terms of crop output. As a result of developments in recent years, wheat cultivation area is projected to increase by 1% in the 2023/24 season.
Table 1. World Wheat Cultivation Area
| Country/Region | 2020/2021 | 2021/2022 | 2022/2023 | 2023/24 proj. |
|---|---|---|---|---|
| India | 31,4 | 31,1 | 30,5 | 31,4 |
| Russia | 28,7 | 27,6 | 29,0 | 28,8 |
| European Union | 23,0 | 24,3 | 24,4 | 24,2 |
| China | 23,4 | 23,6 | 23,5 | 23,6 |
| United States of America | 14,8 | 15,0 | 14,4 | 15,1 |
| Australia | 12,6 | 12,7 | 13,0 | 12,5 |
| Kazakhstan | 12,1 | 12,7 | 12,8 | 13,1 |
| Canada | 10,0 | 9,2 | 10,1 | 10,7 |
| Pakistan | 8,8 | 9,2 | 9,0 | 8,9 |
| Türkiye | 7,1 | 7,1 | 6,8 | 7,2 |
| Ukraine | 6,8 | 7,4 | 5,6 | 5,1 |
| Other | 41,6 | 41,8 | 40,5 | 43,1 |
| WORLD | 220,3 | 221,7 | 219,6 | 222,7 |
Source: USDA (Accessed 27.02.2024), calculated in million hectares.
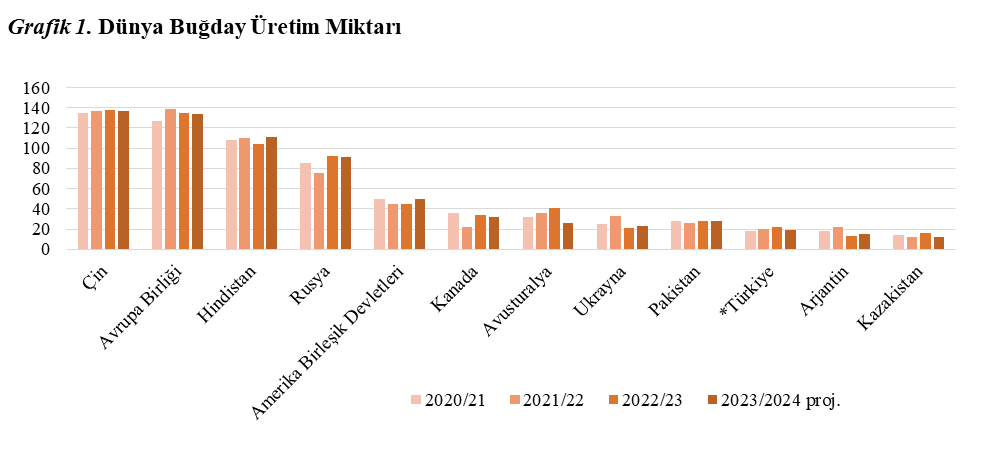
The increase in wheat cultivation areas has also contributed to higher wheat production volumes over the last three years. However, according to the 2023/24 projection, production is expected to decline compared with the previous year, falling to 785.7 million tons.
Table 2. World Wheat Production Volume
| Country/Region | 2020/21 | 2021/22 | 2022/23 | 2023/2024 proj. |
|---|---|---|---|---|
| China | 134,3 | 136,9 | 137,7 | 136,6 |
| European Union | 126,7 | 138,2 | 134,2 | 134,0 |
| India | 107,9 | 109,6 | 104,0 | 110,6 |
| Russia | 85,4 | 75,2 | 92,0 | 91,0 |
| United States of America | 49,8 | 44,8 | 44,9 | 49,3 |
| Canada | 35,4 | 22,4 | 34,3 | 31,9 |
| Australia | 31,9 | 36,2 | 40,5 | 25,5 |
| Ukraine | 25,4 | 33,0 | 21,0 | 23,4 |
| Pakistan | 27,5 | 26,4 | 28,0 | 28,0 |
| Türkiye | 20,5 | 17,6 | 22,3 | 19,5 |
| Argentina | 17,6 | 22,2 | 12,6 | 15,5 |
| Kazakhstan | 14,3 | 11,8 | 16,4 | 12,1 |
| Other | 96,1 | 105,8 | 101,3 | 108,3 |
| WORLD | 772,8 | 780,1 | 789,2 | 785,7 |
Source: USDA (Accessed 27.02.2024), TÜİK, calculated in million tons.
Differences between the rankings of cultivation areas and production volumes vary depending on yield levels across countries. Looking at the figures, it can be seen how much importance even European Union countries, which have among the lowest levels of bread consumption globally, attach to wheat production.
2.2. World Wheat Use and Supply
World wheat beginning stocks, which stood at 297.6 million tons in the 2020/21 marketing year, are estimated to decline by 8.8% to 271.2 million tons in the 2023/24 marketing year. Despite the decline in beginning stocks, world wheat supply is expected to continue increasing slightly due to higher production and imports. During the same period, world wheat use is estimated to increase by 2.6%.
Table 3. World Wheat Supply and Use
| 2020/21 | 2021/22 | 2022/23 | 2023/24 proj. | |
|---|---|---|---|---|
| Beginning Stocks | 297,6 | 283,9 | 272,8 | 271,2 |
| Production | 774,4 | 779,1 | 789 | 785,7 |
| Total Supply | 1264,9 | 1263,8 | 1273,4 | 1266,8 |
| Feed Use | 163,2 | 160,2 | 153,7 | 160,5 |
| Domestic Use | 777,6 | 788,3 | 782 | 796,7 |
| Food, Seed and Industrial Use | 614,4 | 628,1 | 628,3 | 636,3 |
| Total Use | 981 | 991 | 1002,2 | 1007,4 |
| Ending Stocks | 283,9 | 272,8 | 271,2 | 259,4 |
Source: USDA (Accessed 27.02.2024), calculated in million tons.
2.3. World Wheat Imports and Exports
The major wheat-exporting countries and regions worldwide are Russia, the EU, Canada, Australia, the USA, Ukraine, Argentina, Kazakhstan and Türkiye. As of the 2022/23 marketing year, Russia ranked first in world wheat exports with a 24% share, while Türkiye ranked ninth with a 3% share. Türkiye processes the wheat it imports and exports it in the form of value-added products such as pasta, flour, bulgur and semolina.
Table 4. World Wheat Exports
| Country/Region | 2020/21 | 2021/22 | 2022/23 | 2023/2024 proj. |
|---|---|---|---|---|
| Russia | 39,1 | 33,0 | 47,5 | 51,0 |
| European Union | 29,7 | 31,9 | 35,1 | 36,5 |
| Canada | 27,7 | 15,0 | 25,3 | 24,0 |
| Australia | 19,7 | 26,0 | 32,3 | 23,0 |
| United States of America | 26,6 | 21,3 | 20,2 | 20,0 |
| Ukraine | 16,9 | 18,8 | 17,1 | 15,0 |
| Argentina | 9,6 | 17,7 | 4,7 | 10,0 |
| Kazakhstan | 8,1 | 8,5 | 9,9 | 10,0 |
| Türkiye | 6,6 | 6,6 | 7,0 | 9,0 |
| Other | 15,6 | 26,4 | 17,0 | 15,5 |
| WORLD | 199,6 | 205,2 | 216,1 | 214,0 |
Source: USDA (Accessed 27.02.2024), calculated in million tons. Marketing year: June-May.
The leading wheat-importing countries and regions worldwide are China, the EU, Egypt, Indonesia, Türkiye, Algeria, Morocco, the Philippines and Bangladesh. As of the 2022/23 marketing year, China ranked first in wheat imports with a 16% share, while Türkiye ranked second with a 15% share.
Table 5. World Wheat Imports
| Country/Region | 2020/21 | 2021/22 | 2022/23 | 2023/2024 proj. |
|---|---|---|---|---|
| China | 10,6 | 9,6 | 13,2 | 12,0 |
| European Union | 5,4 | 4,6 | 12,1 | 12,0 |
| Egypt | 12,1 | 11,3 | 11,2 | 11,0 |
| Indonesia | 10,0 | 11,2 | 9,4 | 10,5 |
| Türkiye | 8,1 | 9,6 | 12,5 | 10,0 |
| Algeria | 7,7 | 8,3 | 8,1 | 8,3 |
| Morocco | 5,2 | 4,7 | 5,8 | 6,5 |
| Philippines | 6,1 | 6,9 | 5,7 | 5,9 |
| Bangladesh | 7,2 | 6,3 | 5,1 | 5,8 |
| Other | 122,2 | 129,1 | 127,7 | 127,6 |
| WORLD | 194,6 | 201,6 | 210,8 | 209,6 |
Source: USDA (Accessed 27.02.2024), calculated in million tons. Marketing year: June-May.
World wheat exports, which amounted to 216.1 million tons in the 2022/23 marketing year, are projected to decline by 1% to 214 million tons in 2023/24 due to decreases in Australia, Russia and Ukraine. During the same period, imports, which stood at 210.8 million tons, are projected to decline by 0.5% to 208 million tons. Declines in the EU and the Middle East are expected to contribute to the decrease in global wheat imports.
2.4. World Wheat Prices
The war between Russia and Ukraine, which began in the first quarter of the 2022/23 marketing year, together with restrictions affecting foreign trade, caused very significant increases in wheat prices. The main reasons behind these increases were the substantial shares of Russia and Ukraine in the global grain market, disruptions to both land and maritime trade resulting from the war, the consequent slowdown in exports and imports, and the effects of the climate crisis.
Since the beginning of the Russia-Ukraine war, Ukraine's significant efforts to maintain wheat exports and the positive effects of the grain corridor agreement contributed to a partial decline in global wheat prices following the initial shock of the war. As of April, global wheat prices had declined by around 25% year-on-year. The main factors behind this decline included Russia, the world's largest exporter, reaching record wheat shipment volumes in February; strong export competition, particularly among the European Union, Russia and the United States; expectations of a strong global harvest in 2024; and China's cancellation of wheat purchases from both Australia and the United States, which placed downward pressure on markets. Looking at average international wheat export prices in February 2023/24, prices declined by 26% compared with the previous year.
Table 6. International Wheat FOB Prices
| 2023 Q1 | 2023 Q2 | 2023 Q3 | 2023 Q4 | 2024 Q1 | |
|---|---|---|---|---|---|
| United States of America | 377,5 | 370,7 | 323,7 | 296,0 | 285,5 |
| Russia (Black Sea) | 305,0 | 275,0 | 235,0 | 232,0 | 245,0 |
| Australia (APW) | 361,0 | 329,0 | 298,0 | 316,0 | 303,0 |
| Argentina 12% (Upriver Port) | 373,0 | 346,0 | 340,0 | 297,0 | 248,0 |
| European Union (French Wheat Flour) | 321,0 | 285,0 | 250,0 | 247,0 | 245,0 |
| Canada 13% (CWRS) | 373,0 | 344,0 | 337,0 | 312,0 | 315,0 |
Source: USDA (Accessed 27.02.2024), prices calculated as average USD/ton.
2.5. World Wheat Trends and Outlook
According to the “Agricultural Outlook” report covering the 2023-2032 period, prepared by the Organisation for Economic Co-operation and Development and the Food and Agriculture Organization of the United Nations, global production areas are expected to expand by 2%. Advances in harvesting and cultivation technologies are expected to improve yields per unit area in middle-income countries. As a result of improvements in yields, wheat is expected to account for more than one-quarter of the increase in global production. Therefore, measures taken by countries to increase their self-sufficiency are expected to become even more important.
Global wheat production is expected to reach 855 million tons by 2032. Of this increase, 40 million tons is estimated to come from Asian countries.
In recent years, significant increases in production have been observed in Russia, Canada, Argentina and Pakistan. The European Union is projected to surpass China and become the world's largest wheat producer by 2032.
Wheat exports are expected to grow by 20 million tons to approximately 214 million tons by 2032, while Russia is expected to maintain its position in global wheat exports in 2032. The European Union, the second-largest wheat exporter, is expected to account for 17% of global wheat trade by 2032, while wheat consumption is projected to increase by 11% over the next decade.
2.6. Wheat Production in Türkiye
Wheat is produced on approximately 6.8 million hectares of land in Türkiye. In the 2022/23 production year, Konya ranked first in terms of wheat cultivation area with a share of 8.7%, followed by Ankara with 5.5% and Şanlıurfa with 4.6%. The other provinces ranking among Türkiye's top ten in terms of wheat cultivation area are Yozgat, Diyarbakır, Sivas, Tekirdağ, Mardin, Kayseri and Çorum, respectively.
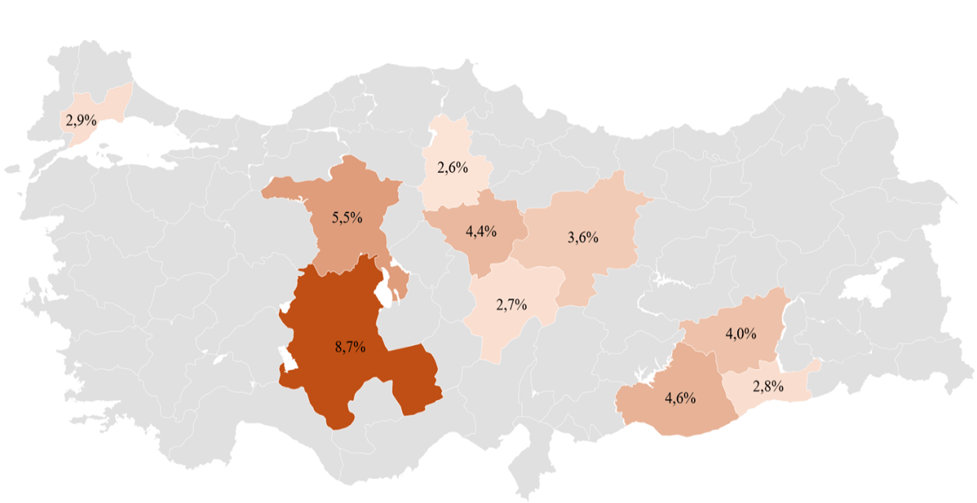
Source: TÜİK (Accessed 27.02.2024)
When Türkiye’s wheat production in the 2022/23 production year is examined, it increased by 12.6% compared with the previous year, reaching 22.3 million tons. The top ten provinces in terms of wheat production account for almost half of the country’s total production.
In the 2022/23 production year, Konya ranked first with a 10% share of production, followed by Şanlıurfa with a 7.7% share and Ankara with a 4.9% share. The other provinces ranking highest in Türkiye in terms of wheat production volume are Diyarbakır, Yozgat, Mardin, Edirne, Tekirdağ, Eskişehir and Sivas, respectively.
Table 7. Production Volume by Province in Türkiye
| 1. | Konya | 2240,1 | 6. | Mardin | 758,0 |
| 2. | Şanlıurfa | 1718,2 | 7. | Edirne | 727,6 |
| 3. | Ankara | 1101,8 | 8. | Tekirdağ | 697,1 |
| 4. | Diyarbakır | 981,6 | 9. | Eskişehir | 611,5 |
| 5. | Yozgat | 951,5 | 10. | Sivas | 604,4 |
Source: TÜİK (Accessed 27.02.2024), calculated in thousand tons.
2.7. Wheat Use and Supply in Türkiye
Türkiye’s beginning wheat stocks, which stood at 4.5 million tons in the 2020/21 marketing year, are estimated to decline by 9.8% to 4.1 million tons in the 2023/24 marketing year. During the same period, Türkiye’s wheat use is estimated to increase by 25.9%.
Table 8. Wheat Supply and Use in Türkiye
| 2020/21 | 2021/22 | 2022/23 | 2023/24 proj. | |
|---|---|---|---|---|
| Beginning Stocks | 4,5 | 3,8 | 2,2 | 4,1 |
| Production | 20,5 | 17,6 | 22,3 | 19,5 |
| Total Supply | 27,6 | 26,2 | 33,2 | 33,6 |
| Feed Use | 2,3 | 2,1 | 2,5 | 1,9 |
| Domestic Use | 18,6 | 18,8 | 19,1 | 19,2 |
| Food, Seed and Industrial Use | 20,6 | 20,2 | 20,6 | 21,1 |
| Total Use | 23,9 | 23 | 26,7 | 30,1 |
| Ending Stocks | 3,7 | 3,2 | 6,6 | 3,5 |
Source: USDA (Accessed 27.02.2024), TÜİK, TEPGE, calculated in million tons.
2.8. Wheat Exports and Imports in Türkiye
Wheat imports in Türkiye are generally carried out for the purpose of exporting processed wheat products. However, climate change may lead to yield losses, while producers may shift towards different crops due to expectations of higher prices. This may result in reductions in wheat cultivation areas, which can be reflected in the market as lower production volumes and increased imports.
In the 2022/23 marketing year, wheat imports amounted to 13.1 million tons. Wheat and meslin accounted for the largest share of wheat imports at 87%. Of total wheat and meslin imports, 98.4% originated from Russia and Ukraine.
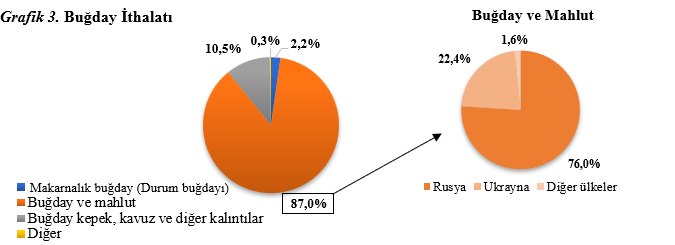
Source: TÜİK (Accessed 27.02.2024)
A large proportion of Türkiye’s wheat product exports consists of wheat and meslin flour and pasta products. Looking at exports in the 2022/23 marketing year, wheat and meslin flour accounted for 70.9%, while pasta accounted for 27.0%. When the destination countries for exports during the same period are examined, Iraq ranked first with a share of 34.2%, followed by Somalia, Syria and Djibouti. In fact, these countries, together with many other African countries, constitute important markets for Türkiye’s exports.
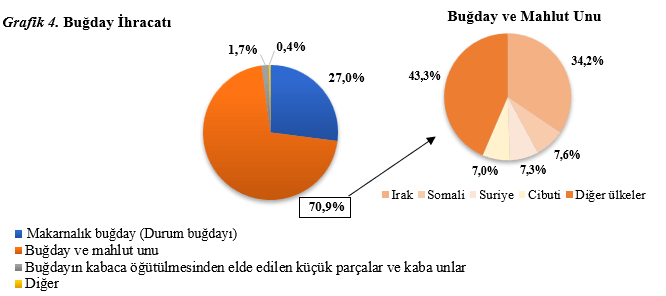
Source: TÜİK (Accessed 27.02.2024)
2.9. Wheat Prices in Türkiye
When the registered prices of Türkiye’s major commodity exchanges are examined, increases can be observed compared with the corresponding periods of the previous year. The highest increase, at 34.3%, occurred at the Edirne and Konya Commodity Exchanges. These were followed by the Polatlı Commodity Exchange with an increase of 33.8% and the İzmir Commodity Exchange with an increase of 20.5%.
The main reason for the increase in domestic wheat prices is the rise in input costs. Since chemical fertilizers, which constitute a significant portion of these inputs, are largely imported, fluctuations in the US dollar exchange rate lead to increases in chemical fertilizer prices. In addition, rising inflation places upward pressure on price formation.
Table 9. Wheat Prices at Major Commodity Exchanges
| 2023 Q1 | 2023 Q2 | 2023 Q3 | 2023 Q4 | 2024 Q1 | |
|---|---|---|---|---|---|
| İzmir Commodity Exchange | 7,3 | 7,0 | 7,0 | 7,5 | 8,8 |
| Konya Commodity Exchange | 6,7 | 6,5 | 7,0 | 8,0 | 9,0 |
| Polatlı Commodity Exchange | 7,7 | 7,7 | 7,7 | 9,0 | 10,3 |
| Edirne Commodity Exchange | 6,7 | 6,4 | 7,0 | 7,8 | 9,0 |
Source: Monthly Registration Bulletins of Konya, Polatlı and Edirne Commodity Exchanges for Hard Red Wheat, and İzmir Commodity Exchange Soft Wheat Producer Sales Kg/Average Prices (Accessed 01.03.2024), calculated.
2.10. Trends and Outlook in Türkiye
Unfortunately, changing climatic conditions are affecting Türkiye’s agriculture just as they are affecting agriculture worldwide. Changes in precipitation, which have a particularly significant impact on yield and quality, are extremely important for Türkiye’s production. An examination of the agricultural report published by the Turkish State Meteorological Service shows that temperatures in wheat-growing areas are above the 30-year average.
Table 10. Average Monthly Temperatures in Türkiye’s Major Wheat-Growing Regions
| Regions | Period | October | November | December | January |
|---|---|---|---|---|---|
| Marmara | 1991-2020 | 15,9 | 11,0 | 7,0 | 5,2 |
| Marmara | *2023/24 | 18,5 | 14,2 | 10,3 | 7,4 |
| Aegean | 1991-2020 | 17,3 | 11,8 | 7,9 | 6,3 |
| Aegean | *2023/24 | 19,1 | 14,9 | 11,2 | 8,5 |
| Mediterranean | 1991-2020 | 19,4 | 13,4 | 9,1 | 7,5 |
| Mediterranean | *2023/24 | 21,0 | 16,2 | 12,0 | 10,3 |
| Central Anatolia | 1991-2020 | 12,7 | 5,9 | 1,4 | -0,6 |
| Central Anatolia | *2023/24 | 14,3 | 9,7 | 5,5 | 2,9 |
| Southeastern Anatolia | 1991-2020 | 19,5 | 11,5 | 6,4 | 4,6 |
| Southeastern Anatolia | *2023/24 | 20,3 | 13,7 | 9,3 | 7,1 |
Source: Turkish State Meteorological Service, Agricultural Meteorology Bulletin (Accessed 01.03.2024), values are given in °C.
Autumn precipitation in 2023 was above both the seasonal average and the previous year's levels across Türkiye. The nationwide autumn precipitation average for the 1991-2020 period was 132.7 mm, while autumn precipitation in the previous year was 96.3 mm and autumn precipitation in 2023 reached 162.6 mm. Nationwide autumn precipitation increased by 23% compared with the seasonal average and by 69% compared with the previous year's autumn season.
In Central Anatolia, which accounts for 37% of Türkiye's wheat production, precipitation was 59% above normal. In Southeastern Anatolia, which accounts for 15% of wheat production, precipitation was 98% above normal, while in the Marmara Region, which accounts for 11% of wheat production, precipitation exceeded normal levels by more than 100%. These increases in precipitation in recent months are expected to have a positive impact on wheat yields.
The 2022/23 production season was a productive year for wheat. Therefore, planting levels were also quite strong in the current production season. Rainfall received at the beginning of the season was encouraging. However, the fact that temperatures did not fall to the desired low levels in January, February and March 2024, together with limited snowfall and winter rainfall remaining below desired levels, has caused some concern among sector stakeholders. Nevertheless, if climatic conditions remain favorable for wheat production, yields similar to those achieved in the previous production season are expected this season.
According to USDA projections, the wheat harvest expected to reach 19.5 million tons in the 2023/24 production year could exceed expectations if adverse climatic conditions do not occur.
Price is such a critical parameter that it can rapidly change both producer behavior and the direction of the market. Last season, prices for certain cereal products remained below expectations, bringing wheat to the forefront.
Although Türkiye's stocks and production levels currently appear favorable, global prices are not influenced solely by production and stocks in Türkiye. Global stocks, production expectations, demand volumes and strategies all affect prices. In addition, excess supply in Türkiye may place downward pressure on domestic prices.
The prices to be announced by the Turkish Grain Board (TMO) are extremely important in determining the direction of the market. When setting prices, it is important to consider both Türkiye's competitiveness in global markets and the economic sustainability of production at a time when production costs are increasing. The amount of support to be provided is also important in preventing producers from being adversely affected by price pressure that may result from excess supply.
Last year, the TMO purchase prices were announced as 8.25 TL/kg for bread wheat and 9.00 TL/kg for durum wheat. Wheat prices, which currently show no negative trend, may be announced above last year's levels.
In addition, the fact that corn, another cereal crop, remained below price expectations last year is expected to have contributed to an increase in wheat cultivation in some regions.
In addition to climatic conditions that directly affect yields, factors such as input costs, storage and transportation conditions, relations between countries, population, expectations, sudden developments and, of course, current developments will also influence the formation of wheat prices.
3. Current Developments and Outlook in the Wheat Sector
The increase in demand for staple food products, which began with the Covid-19 pandemic and continues today, has also increased the consumption of wheat products. Rising consumption of durable food products such as pasta and bulgur is contributing to higher demand for wheat. This supports the expectation that countries such as Türkiye, which export wheat-based products, will continue to maintain their advantage.
According to USDA 2023/24 projections, wheat cultivation and production are expected to decline in Russia and Ukraine, and wheat produced in these regions is expected to remain a determining factor in global wheat prices.
At this point, the Grain Corridor Agreement signed between Türkiye, Russia, Ukraine and the United Nations on July 22, 2022 is of great importance. Under this agreement, nearly 10 million tons of wheat were shipped from ports. According to the USDA, if the agreement is not continued, Ukraine's wheat exports are expected to decline.
Numerous farmer protests across EU countries have prompted some countries to take measures to protect their domestic producers. Despite warnings that unilateral actions would conflict with the European Union's trade policies, Poland and Hungary have continued taking steps to support their producers by banning Ukrainian grain from entering their domestic markets.
Houthi attacks in Yemen, triggered in the aftermath of the Israel-Palestine war, are creating major obstacles to maritime trade in the Red Sea. These disruptions are forcing commercial vessels to use longer routes, increasing costs and extending delivery times. According to a report published by the World Trade Organization, the volume of wheat passing through the Suez Canal has declined, affecting wheat trade from the EU, Russia and Ukraine to East Africa and Asian countries.
India, which has been struggling with drought caused by “El Niño” heat waves, introduced export restrictions in 2022 to protect its producers. According to current data from the India Meteorological Department, insufficient rainfall in January and February could reduce the wheat harvest, contrary to USDA's 2023/24 projections. This negative outlook could increase India's import volumes.
According to USDA's 2023/24 wheat production estimates for Australia, the expected decline of more than 60% in wheat production could negatively affect the country's exports. An examination of World Bank data on Australia's wheat trade shows that Asian countries account for a very large proportion of its exports. Potential export difficulties could therefore create new opportunities in the Asian market.
4. References
World Food Situation 2024,
https://www.fao.org/worldfoodsituation/csdb/en/
United States Department Of Agriculture Economic Research Service 2024,
https://www.ers.usda.gov/webdocs/outlooks/106544/whs-23e.pdf?v=9179.4
United States Department Of Agriculture 2024,
https://apps.fas.usda.gov/psdonline/circulars/grain.pdf
https://apps.fas.usda.gov/psdonline/app/index.html#/app/advQuery
Agriculture and Horticulture Development Board 2024,
https://ahdb.org.uk/sector-plans/cereals-oilseeds
Republic of Türkiye Ministry of Agriculture and Forestry, Wheat Situation and Forecast Report 2023,
https://arastirma.tarimorman.gov.tr/tepge/Belgeler/PDF%20Durum-Tahmin%20Raporlar%C4%B1/2023%20Durum-Tahmin%20Raporlar%C4%B1/Bu%C4%9Fday%20Durum%20Tahmin%20Raporu%202023-384%20TEPGE.pdf
Anonymous 2024,
https://millermagazine.com/tr/blog/kuresel-tahl-gorunumu-2024-ve-otesine-baks-5536
https://www.tarimdanhaber.com/bugdayda-yeni-bolluk-yili-mi-rekolte-tahminlerinizi-alalim
https://www.spglobal.com/commodityinsights/en/market-insights/latest-news/agriculture/021924-indias-2023-24-wheat-crop-seen-slightly-lower-on-year-below-govt-estimates
Australian Bureau of Agricultural and Resource Economics and Sciences 2024,
https://www.agriculture.gov.au/abares/research-topics/agricultural-outlook/wheat
World Integrated Trade Solution 2024,
https://wits.worldbank.org/trade/country-byhs6product.aspx?lang=en
International Grains Council 2024,
https://www.igc.int/en/gmr_summary.aspx
Statistisches Bundesamt 2024,
https://www.destatis.de/EN/Themes/Economic-Sectors-Enterprises/Agriculture-Forestry-Fisheries/Field-Crops-Grassland/Tables/arable-land-after-the-main-groups-and-crops.html
United States Wheat Associates 2024,
https://www.uswheat.org/wheatletter-report-categorys/market-and-crop-analysis/
Agweb Farm Journal 2023, 2024
https://www.agweb.com/news/policy/politics/whats-latest-black-sea-grain-deal
https://www.agweb.com/news/policy/politics/russia-taking-page-out-chinas-playbook-working-take-control-its-grain-industry
https://www.agweb.com/news/policy/politics/battle-ukraine-untold-farming-people-and-infrastructure-stories-front-lines
UkrAgroConsult 2024,
https://ukragroconsult.com/en/grain-prices/
https://ukragroconsult.com/en/news/indias-wheat-stocks-hit-seven-year-low-after-record-state-sale/
Miling Middle East and Africa Magazine 2023, 2024,
https://www.millingmea.com/indias-wheat-production-is-likely-to-reach-108-million-metric-tons-in-my-2023-24-usda/
National Grain Council 2023,
http://www.uhk.org.tr/tr/wp-content/uploads/2023/12/uhk2023yilihububatraporu2024beklentipaneli.pdf
India Meteorological Department, Ministry of Earth Sciences 2024,
https://mausam.imd.gov.in/imd_latest/contents/meteorological-agriculture-services.php
Turkish State Meteorological Service 2024,
https://www.mgm.gov.tr/FTPDATA/zirai/urunler/aylikbulten.pdf
Organisation for Economic Co-operation and Development 2023,
https://www.oecd-ilibrary.org/sites/08801ab7-en/index.html?itemId=/content/publication/08801ab7-en
Turkish Statistical Institute 2023, 2024,
https://data.tuik.gov.tr/Kategori/GetKategori?p=tarim-111&dil=1
https://data.tuik.gov.tr/Kategori/GetKategori?p=dis-ticaret-104&dil=1
https://data.tuik.gov.tr/Bulten/Index?p=Bitkisel-Urun-Denge-Tablolari-2022-49456
https://data.tuik.gov.tr/Bulten/Index?p=Bitkisel-Uretim-Istatistikleri-2023-49535
https://data.tuik.gov.tr/Bulten/Index?p=Tarim-Urunleri-Uretici-Fiyat-Endeksi-Ocak-2024-53491
Blog Photos

Writer : Ar-Ge Müdürlüğü
Unless otherwise stated, this published article does not reflect the views of the Izmir Commodity Exchange. 


